Break-Even Analysis and Forecasting
Break-even analysis depends on the following variables:
- Selling Price per Unit:The amount of money charged to the customer for each unit of a product or service.
- Total Fixed Costs: The sum of all costs required to produce the first unit of a product. This amount does not vary as production increases or decreases, until new capital expenditures are needed.
- Variable Unit Cost: Costs that vary directly with the production of one additional unit.
Total Variable Cost The product of expected unit sales and variable unit cost, i.e., expected unit sales times the variable unit cost.
- Forecasted Net Profit: Total revenue minus total cost. Enter Zero (0) if you wish to find out the number of units that must be sold in order to produce a profit of zero (but will recover all associated costs)
Total Cost: The sum of the fixed cost and total variable cost for any given level of production, i.e., fixed cost plus total variable cost.
Total Revenue: The product of forecasted unit sales and unit price, i.e., forecasted unit sales times unit price.
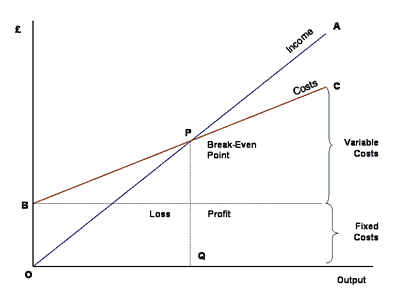
Break-Even Point: Number of units that must be sold in order to produce a profit of zero (but will recover all associated costs). In other words, the break-even point is the point at which your product stops costing you money to produce and sell, and starts to generate a profit for your company.
One may use the JavaScript to solve some other associated managerial decision problems, such as:
- setting price level and its sensitivity
- targeting the "best" values for the variable and fixed cost combinations
- determining the financial attractiveness of different strategic options for your company
The graphic method of analysis (below) helps you in understanding the concept of the break-even point. However, the break-even point is found faster and more accurately with the following formula:
Q = Break-even Point, i.e., Units of production (Q),
FC = Fixed Costs,
VC = Variable Costs per Unit
UP = Unit Price
Therefore,
You may like using the JavaScript for performing some sensitivity analysis on the above parameters to investigate their impacts on your decision-making.

Back to:
Time-Critical Decision Making for Economics and Finance
Kindly email your comments
to:
Professor Hossein Arsham