Polynomial Regression and Root-Finder

Polynomial Regression and Root-Finder

This site is a part of the JavaScript E-labs learning objects for decision making. Other JavaScript in this series are categorized under different areas of applications in the MENU section on this page.

Professor Hossein Arsham   


Polynomial regression models are often used in economics areas such as utility function , forecasting, cost-befit analysis, etc. This JavaScript provides polynomial regression up to fourth degrees. This site also presents a JavaScript implementation of the Newton's root finding method.

Prior to using this JavaScript it is necessary to construct the scatter-diagram for your data. Visual inspection of the scatter-diagram enables us to determine what degree of polynomial regression is the most appropriate for fitting to your data.

Enter your at-least-8, and up-to-16 sample (X, Y) and the data sets of X2, and X3, for third-order polynomial, for the fouth order enter also X4. After entering your necessary entries, then click the Calculate button.

Obviously, sample size is going to limit how many terms you want to use in the polynomial regressions.

Notice: The JavaScript enables you to perform serial-residual analysis provided you enter the independent variable X in increasing order.

In entering your data to move from cell to cell in the data-matrix use the Tab key not arrow or enter keys.

The Newton's Root-Finder: Newton devised an iterative process, called Newton's Method for finding the roots of functions.

A root of a function f(X) is a number X* for which f(X*) = 0. That is, the graph of y = f(X) crosses the X-axis at X*.

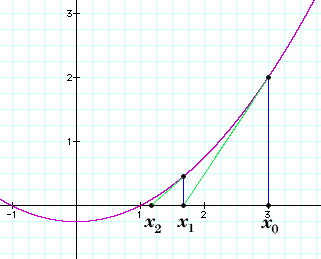
Here are the steps for the Newton's root-finder method:

  1. Guess a number X0 If f(X0) = 0, we are done. If not,
  2. Draw the vertical line from (X0,0) to (X0, f(X0)).
  3. Draw the line tangent to the graph of y = f(X) at the point (X0, f(X0)).
  4. Usually, this tangent line intersects the X-axis at a point (X1, 0).
  5. Repeat the process with X1 taking the place of X0.
  6. Continue until f(Xn) is close enough to 0.

This process is illustrated for a typical example in the following figure:
Partitioning the Three Sum of Squares

A Geometrical Interpretation of the First Few of Iterations of Newton's Formula
Click on the image to enlarge it

In other words, the Newton iteration is then given by the following procedure: start with an initial guess of the root X0, then find the limit of of the following Newton’s recurrence formula:


Xn+1 = Xn -    f (Xn)

¢(Xn)

Numerical Example: Suppose we are intersted in finding a root of equation X3 - 2X2 + 3X - 43 = 0. The following The Newton's Root-Finder JavaScript is an implementation of Newton’s recurrence formula.

Exercise your Skill: Consider the following 4th order polynomial f(X) = X4 + 48X3 + 18X2 - 4X, which has four roots all within the range [-2.0, 2.0], can you find them all? Try it by utilizing the JavaScript.


The Fitted Model is :


  X X2 X3 X4 Y Predicted
Y values
1
2
3
4
5
6
7
8
9
10
11
12
13
14
15
16
Diagnostic Tools for Data Transformation Decisions
R-Square F-Statistic
Mean Variance
Mean:
The first half
Mean:
The second half
Variance:
The first-half
Variance:
The second half
First order serial-correlation Second order serial-correlation
Durbin-Watson statistic Mean absolute errors
Normality Condition:
ith Residual:


The Newton's Root-Finder


For Technical Details, Back to:
Business Statistics


Kindly email your comments to:
Professor Hossein Arsham


Análisis de Regresión Polinomial
Nota para los usuarios de habla hispana:
Modelos de regresiones polinomiales son normalmente usadas en áreas económicas tales como en la función de utilidad predicciones análisis de costo beneficio, etc. Este JavaScript proporciona regresiones Polinomiales hasta de cuarto grado.
Antes de utilizar este JavaScript es necesario construir un para sus datos. Una inspección visual al diagrama de dispersión nos posibilitara determinar en que grado la regresión polinomial es la mas apropiada para ajustar los datos.
Introduzca hasta 16 conjunto de pares de datos (X, Y) para el modelo lineal, conjunto triple de datos (X, X2, Y), para un modelo cuadrático, y así respectivamente. Luego de introducir todos los datos necesarios presione el botón Calculate (Calcular.)

Nota: Este JavaScript le facilita a usted realizar Análisis de Series Residuales, siempre y cuando usted introduzca variables independientes X en orden creciente. Mientras entre sus datos en la matriz, muévase de celda a celda usando la tecla Tab,no use la flecha o la tecla de entrada. Los resultados que usted obtendrá de esta matriz son:
The Fitted Model is = El Modelo Ajustado es
Predicted Y values = Valores Y estimados
Diagnostic Tools for Data Transformation Decisions = Herramientas Diagnósticas para Decisiones sobre Transformaciones de Datos
R- square = R al cuadrado
F- statistic = Estadístico F
Mean = Media
Variance = Varianza
Mean the fisrst half = Media de la Primera Mitad
Mean the second half = Media de la Segunda Mitad
Variance the fisrst half = Varianza de la Primera Mitad
Variance the second half = Varianza de la Segunda Mitad
Second order serial- correlation = Correlación de Serie de Segundo Grado
First order serial- correlation = Correlación de Serie de Primer Grado
Durbin- Watson Statistic = Estadístico Durbin- Watson
Mean Absolute Error = Error Absoluto de la Media
Normality Condition = Condición de Normalidad
Ith Residual = Iésimo Residuo

Para Detalles Técnicos y Aplicaciones, Vuelta a:
Razonamiento Estadístico para la Toma de Decisiones Gerenciales


MENU

Decision Tools in Economics & Finance


Probabilistic Modeling

 
Statistics


The Copyright Statement: The fair use, according to the 1996 Fair Use Guidelines for Educational Multimedia, of materials presented on this Web site is permitted for non-commercial and classroom purposes only.
This site may be translated and/or mirrored intact (including these notices), on any server with public access. All files are available at http://home.ubalt.edu/ntsbarsh/Business-stat for mirroring.

Kindly e-mail me your comments, suggestions, and concerns. Thank you.

Professor Hossein Arsham   


Back to:

Dr Arsham's Home Page


EOF: © 1994-2015.