1.1 Current Course Information
2.1 Sample of Final Exam: Inferential Statistics Questions
2.2 Samples of Final Exam: Descriptive Statistics Questions
2.3 Sample of Final Examination Questions: Applications of Statistical Tables
2.4 Sample Solution to Your Midterm Examination
2.5 Statistical Concepts You Need For Your Professional Life
2.6 Course Technical Summary-Sheet
2.7 Course Descriptive Summary-Sheet
2.8 Useful Notes
1.4 Statistical Keywords and Phrases (Incomplete List)
3. An Overview of the Course
3.1 What is your (or your customers) Expectation of the product/service you buy (or that your sell)? That is, what is a good estimate for m ?
3.2 Given the information about your (or your customers) expectation, what is the Quality of the product/service you buy (or that you sell)? That is, what is a good estimate for s ?
3.3 Given the information about what you buy (or your sell) expectation, and the quality of the product/service, how does the product/service compare with other existing similar types? That is, comparing several m 's, and several s 's.
4. High school math refresher (Done)
6. Lecture on Probability and Expected Values Financial Portfolios Selection Processes Applications of Geometric and Harmonic Means
7.1 Samples of Questions for the Midterm Examinations
7.2 Lecture Notes Review and Walking Through the Chapters from Your Textbook.
8. Inferential Statistics
8.1
Central Limit Theorem in Action Central Limit Theorem in Details
Why Normal Distribution Is So Popular?
8.2 All Statistical Tables Required the Normality Condition: How Do You Justify It?
8.3 How to Decide What Statistical Table to Use?
8.4 Statistical Tables Are Related
8.5 What is the Margin of Error?
8.6 Parameters Estimations with Confidence
8.7 Test of Hypothesis: Validity of Claims about Populations Parameters
8.8 Inference For the population Variance (The Quality)
8.9 Analysis of Variance in Action (Session 8) The Bartlett's Test: Homogeneity of Multi-variances
8.10 Regression Analysis: Prediction Modeling (Session 9)
8.11 Unification of ANOVA, Regression, and T-Test
8.12 The Pooled-Variances T-Test and ANOVA Connection
8.13 ANOVA and Regression Analysis Connection
8.14 Reading-off From Statistical Tables
8.15 The Meaning and Interpretation of P-values (what the data say?)
8.16 The P-values for the Popular Distributions
8.17 Readings for Understanding: Walking Through Chapters From Your Textbook
8.18 Print some graph papers you need for ANOVA and Regression Analysis:
Graph paper (Word.Doc), Graph paper (PDF)
9. Samples of Homework (Unedited)
Find out your HW grades with my general comments on The Sakai: ubonline.ubalt.edu/portal/xlogin
9.1 Samples of Session 1 HW: What is business statistics? Questions for your next week Essay
9.2 Samples of Session 2 HW: Parts of Descriptive Statistics 2-Collections: Book Homework Session 2
9.3 Samples of Session 3 HW: 3-Collections: Probability Concepts and Applications 3-Collections: Book Homework Chapters 4 and 5 Session 3
9.4 Samples of Sessions 4, and 5 HW: Probability Distributions with Applications Book Homework Chapters 6 and 7 Session 5
9.5 Samples of Session 6 HW: Estimation with Confidence Book Homework Chapter 8 Session 6
Another Book Homework Chapter 8 Session 6
9.6 Samples of Session 7 HW: Hypothesis Testing with Applications Book Homework Chapters 9 and 10 Session 7 Book Homework Chapters 9 and 10 Session 7 Another Book Homework Session7
9.7 Samples of Session 8 HW: Analysis of Variance (ANOVA): Equality of Several Populations ANOVA Session 8
9.8 Samples of Session 9 HW: Linear Regression wit Applications Book Homework Chapter 13 Session 9
10. After Doing your Reading Assignments (The Textbook and Lecture Notes for the Relevant Sessions) Walk Through the following PPT Presentations:
10.1 Descriptive Statistics
10.2 Probability, Expected Values, and Distribution of Random Variables
10.3 Active Learning: Interactive Statistics and Probability
10.4 Statistical JavaScript E-labs Learning Objects
10.5 Mean, Median, and Mode: Central Statistics
10.6 Get Familiarity with Excel by Doing Some of Your Homework to Check
11. Bring-in your scientific calculator and textbook in every class meeting
Please send me an email (harsham@ubalt.edu) if you find any link is broken. Thank you for contributing to our learning process.
To search the site, try Edit | Find in page [Ctrl + f]. Enter a word or phrase in the dialogue box, e.g. "homework" If the first appearance of the word/phrase is not what you are looking for, try Find Next.
Table of Contents
Notice that this is an intense quantitative-based course requiring at least 10/15 hrs each week to succeed. Notice also that any late homework has zero value.
| Fall Schedule and Homework Assignment | |||||
| Sessions | Dates | Topics | Homework Due Date | ||
| 1 | Weeks of Monday Aug 25 and Sept 1 | What Is Business Statistics? | W Sept 10 | ||
| 2 | Week of Monday Sept 15 | Descriptive Statistics | W Sept 17 | ||
| 3 | Week of Monday Sept 22 | Probability and Expected Values | W Sept 24 | ||
| 4 | Weeks of Monday Sept. 29, Oct 6 | Review, Practice, and First Exam | W Oct 8 | ||
| 5, 6 | Week of Monday Oct 13, 20 |
Discrete & Continuous Distributions Sampling Distribution and the CLT |
W Oct 22 | ||
| 7 | Weeks of Monday Oct 27, Nov 3 | Statistical Interference | W Nov 5 | ||
| 8 | Week of Monday Nov 10 | Analysis of Variance | W Nov 12 | ||
| 9 | Weeks of Monday Nov 17 | Regression, Covariance, and Correlation | W Nov 19 | ||
| 10 | Weeks of Monday Nov 24, Dec 1, Dec 8 | Final Exam | W Dec 10 | ||
Homework 1: What Is Business Statistics?
Welcome to Business Statistics
I am looking forward to working with you and hope that you will find the course both enjoyable and informative.
This is an course in statistics. It is a second course in statistics designed to provide you with the basic concepts and methods of statistical analysis for processes and products. The course is tailored to meet your needs. Accordingly, all the application problems are borrowed from business and economics:
By the end of this course you'll be able to think statistically. The cardinal objective for this course is to increase the extent to which statistical thinking is embedded in management thinking for decision making under uncertainties. It is already an accepted fact that "Statistical thinking will one day be as necessary for efficient citizenship as the ability to read and write." So, let's be ahead of our time.
This course site is created for you. No one needs to be ashamed of what he or she does not know or how long it takes to master new information. Learning on the Web can be non-judgmental and self-paced. Using advantages of this technology to expand learning opportunities is particularly crucial because we live in a time when learning is becoming a necessity not a luxury.
The letters in your course number: OPRE 202, stand for OPerations REsearch. OPRE is a science assisting you to make decisions (based on some numerical and measurable scales) by searching and re-searching for a solution. I refer you to What Is OR/MS? for a deeper understanding of what OPRE is all about. Decision-making process must be based on data, neither on personal opinion neither on belief.
By the end of this course, you'll be able to apply statistical concepts and methodologies when performing data analysis. You will learn how to execute these analyses using a variety of computers and computer-based tools. You will even learn how to do many of these analyses using that most personal of computer tools, the scientific/business calculator.
To be competitive, business must design quality into products and processes. Further, they must facilitate a process of never-ending improvement at all stages of manufacturing. A strategy employing statistical methods, particularly statistically designed experiments, produces processes that provide high yield and products that seldom fail. Moreover, it facilitates development of robust products that are insensitive to changes in the environment and internal component variation. Carefully planned statistical studies remove hindrances to high quality and productivity at every stage of production, saving time and money. It is well recognized that quality must be engineered into products as early as possible in the design process. One must know how to use carefully planned, cost-effective experiments to improve, optimize and make robust products and processes.
The Devil is in the Deviations: Variation is inevitability in life! Every process has variation, as does every measurement, and every statistical sample. Managers need to understand variation for two key reasons. They can lead others to apply statistical thinking in day-to-day activities and secondly, to apply the concept for the purpose of continuous improvement. This course will provide you with hands-on experience to promote the use of statistical thinking and techniques to apply them to make educated decisions whenever you encounter variation in business data. You will learn techniques to intelligently assess and manage the risks inherent in decision-making. Therefore, remember that:
Just like weather, if you cannot control something, you should learn how to measure and analyze, in order to predict it, effectively.
If you have taken statistics before, and have a feeling of inability to grasp concepts, it is largely due to your former non-statistician instructors teaching statistics. Their deficiencies lead students to develop phobias for the sweet science of statistics. In this respect, Professor Herman Chernoff makes the following remark, in Statistical Science, Vol. 11, No. 4, 335-350, 1996:
"Since everybody in the world thinks he can teach statistics even though he does not know any, I shall put myself in the position of teaching biology even though I do not know any."
Plugging numbers in the formulas and crunching them has no value by themselves. You should continue to put effort into the concepts and concentrate on interpreting the results.
Even, when you solve a small size problem by hand, I would like you to use the available computer software and Web-based computation to do the dirty work for you.
You must be able to read off the logical secrete in any formulas not memorizing them. For example, in computing the variance, consider its formula. Instead of memorizing, you should start with some whys:
This was just an example for you to show as how to question the formulas rather than memorizing them. In fact when you try to understand the formulas you do not need to remember them, they are parts of your brain connectivity. Clear thinking is always more important than the ability to do a lot of arithmetic.
When you look at a statistical formula the formula should talk to you, as when a musician looks at a piece of musical-notes he/she hears the music. How to become a statistician who is also a musician?
The objectives for this course is to learn statistical thinking; to emphasize more data and concepts, less theory and fewer recipes; and finally to foster active learning using, e.g., the useful and interesting Web sites.
In this diverse world of ours, no two things are exactly the same. A statistician is interested in both the differences and the similarities, i.e. both patterns and departures.
Exploratory analysis of data makes use of numerical and graphical techniques to study patterns and departures from patterns. The widely used descriptive statistical techniques are: Stem & Leaf, Box Plot, Frequency Distribution, Empirical Cumulative Distribution, Histograms; and Scatter-diagram.
The actuarial tables published by insurance companies reflect their statistical analysis of the average life expectancy of men and women at any age. From these numbers, the insurance companies then calculate the appropriate premiums for a particular individual to purchase a given amount of insurance.
In examining distributions of data, you should be able to detect important characteristics, such as shape, location, variability, and unusual values. From careful observations of patterns in data, you can generate conjectures about relationships among variables. The notion of how one variable may be associated with another permeates almost all of statistics, from simple comparisons of proportions through linear regression. The difference between association and causation must accompany this conceptual development.
Data must be collected according to a well-developed plan if valid information on a conjecture is to be obtained. The plan must identify important variables related to the conjecture and specify how they are to be measured. From the data collection plan, a model can be formulated from which inferences can be drawn.
That the size of a rally can have important political consequences was demonstrated in 1995 when the controversial "Million Man March on Washington" was held. March organizers steadfastly maintained the official attendance estimates offered by the U. S. Park Service (300,000) were too low. Is it?
What is statistics and what can it do? The main objective of this unit is to orient you to the subject of Business Statistics. When you have successfully completed this unit, you will know what to expect from this course and you will have an overview of the topics involved in the weeks to come. In the course you will learn to use statistical techniques to investigate business situations, and you will gain a good understanding of statistical ideas and thinking.
Topics:
In this diverse world of ours, no two things are exactly the same. A statistician is interested in both the differences and the similarities; i.e. both patterns and departures.
Exploratory analysis of data makes use of numerical and graphical techniques to study patterns and departures from patterns. The widely used descriptive statistical techniques are: Stem & Leaf, Box Plot, Frequency Distribution, Empirical Cumulative Distribution, Histograms; and Scatter-diagrams.
The actuarial tables published by insurance companies reflect their statistical analysis of the average life expectancy of men and women at any age. From these numbers, the insurance companies then calculate the appropriate premiums for a particular individual to purchase a given amount of insurance.
In examining distributions of data, you should be able to detect important characteristics, such as shape, location, variability, and unusual values. From careful observations of patterns in data, you can generate conjectures about relationships among variables. The notion of how one variable may be associated with another permeates almost all of statistics, from simple comparisons of proportions through linear regression. The difference between association and causation must accompany this conceptual development.
Data must be collected according to a well-developed plan if valid information on a conjecture is to be obtained. The plan must identify important variables related to the conjecture and specify how they are to be measured. From the data collection plan, A model can be formulated from which inferences can be drawn.
The Birth of Statistics
The original idea of statistics was the collection of information about and for the State.
The birth of statistics occurred in mid-17th century. A commoner named John Graunt, who was a native of London; begin reviewing a weekly church publication issued by the local parish clerk that listed the number of births, christenings, and deaths in each parish. These so called Bills of Mortality also listed the causes of death. Graunt who was a shopkeeper organized these data in the forms we call descriptive statistics which was published as Natural and Political Observation Made upon the Bills of Mortality. Shortly he was elected as a member of Royal Society. Thus, statistics has to borrow some concepts from sociology such as the concept of population. It has been argued that since it usually involves the study of human behavior therefore it cannot claim the precision of the physical sciences.
Some Illustrative Statistical Applications
Here are a few examples that illustrate the variety of statistical applications.
What Is Business Statistics?
The letters in your course number: OPRE504, stand for OPerations RE-search. OPRE is a science of making decisions (based on some numerical and measurable scales) by searching, and re-searching for a solution. I refer you to What Is OR/MS?, for a deeper understanding of what OPRE is all about.
The main objective of Business Statistics is to make inferences (predictions, decisions) about certain characteristics of a population based on information contained in a random sample.
Business Statistics is the science of "good" decision making in the face of uncertainty and is used in many disciplines, such as financial analysis, econometrics, auditing, production and operations, and marketing research. It provides knowledge and skills to interpret and use statistical techniques in a variety of business applications. A typical Business Statistics course is intended for business majors, and covers statistical study, descriptive statistics (collection, description, analysis, and summary of data), probability, and the binomial and normal distributions, test of hypotheses and confidence intervals, linear regression, and correlation.
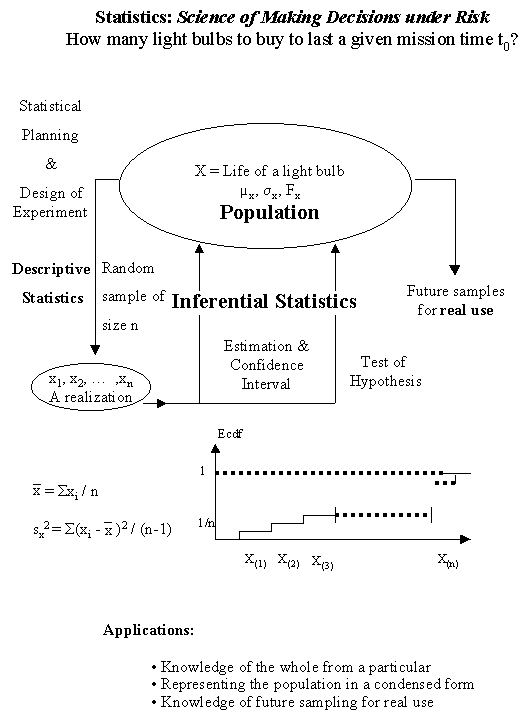
Statistical topics are about decision-making with respect to the characteristics of a group of persons or objects on the basis of numerical information obtained from a randomly selected sample of the group. Statisticians refer to this numerical observation as realization of a random sample. However, notice that one cannot see a random sample. A random sample is a relatively sample from outcomes of a random process.
At the planning stage of a statistical investigation, the question of sample size (n) is critical. For example, sample size for sampling from a finite population of size N, is set at: N 1/2 1, rounded up to the nearest integer. Clearly, a larger sample provides more relevant information, and as a result a more accurate estimation and better statistical judgment regarding test of hypotheses.
Under-lit Streets and the Crimes Rate: It is a fact that if residential city streets are under-lit then major crimes take place therein. Suppose you are working in the Mayer's office and put you in charge of helping him/her in deciding which manufacturers to buy the light bulbs from in order to reduce the crime rate by at least a certain amount, given that there is a limited budget?
The major task of statistics is to study the characteristics of populations whether these populations are people, objects, or collections of information. For two major reasons, it is often impossible to study and entire population:
- The sampling process would be too expensive or time-consuming.
- The sampling process would be destructive.
In either case, we would resort to looking at a sample chosen from the population and trying to infer information about the entire population by only examining the smaller sample. Very often the numbers which interest us most about the population are the mean and standard deviation. Any number -- like the mean or standard deviation -- which is calculated from any entire population is called a parameter. If the very same numbers are derived only from the data of a sample, then the resulting numbers are called statistics. Frequently, parameters are represented by Greek letters and statistics by Latin letters (as shown in the above Figure).
Probability is the tool used for anticipating what the distribution of data should look like under a given model. Random phenomena are not haphazard: they display an order that emerges only in the long run and is described by a distribution. The underlying description of variation is central to statistics. The probability required for statistical inference is not primarily axiomatic or combinatorial, but is oriented toward describing data distributions.
Statistical inference refers to extending your knowledge obtained from a random sample of population to the whole population. This is known in mathematics as inductive reasoning. That is, knowledge of the whole from a particular. Its main application is in hypotheses testing and estimation about a given population characteristics.
Statistical inference guides the selection of appropriate statistical models for testing or estimation. Models and data interact in statistical work. Models are used to draw conclusions from data, while the data are allowed to criticize and even falsify the model through inferential and diagnostic methods. Inference from data can be thought of as the process of selecting a reasonable model, including a statement in probability language of how confident one can be about the selection.
Statistics is a mathematical modeling tool that enables us to impose order on the disorganized cacophony of the real world of modern society. The business world has grown both in size and competition. Corporations must perform risky businesses, hence the growth in popularity and need for business statistics.
Business statistics has grown out of the art of constructing charts and tables! It is now, a science of basing decisions on numerical data in the face of uncertainty. Business statistics is a scientific approach to decision making under risk. In practicing business statistics, we search for an insight, not the solution. Our search is for the one solution that meets all the business' needs with the lowest level of risk. A business analyst can take a normal business situation and with the proper data gathering, analysis, and re-search for a solution, turns it into an opportunity.
While business statistics cannot replace the knowledge and experience of the decision maker, it is a valuable tool that the manager can employ to assist in the decision making process in order to reduce the inherent risk measured by, e.g., the standard deviations.
Among other useful questions, you may ask why we are interested in estimating the populations' expected value m and its Standard Deviation s ? Here are some applicable reasons. Business Statistics must provide justifiable answers to the following concerns for every consumer and producer:
Know that statistical methods have two major branches: Descriptive and Inferential. In the first two units, we will deal with Descriptive Statistical Methods; in the time remaining we will deal with Inferential Statistical Methods.
Example of descriptive statistics: "The average income of a random sample of 104 families in Baltimore City is $28,673."
Example of inferential statistics: "This sample of 104 families from Baltimore City indicates with 95% confident we can conclude that the average family income in the Baltimore City is between $25,187 and $29,328."
(An exact interpretation of Confidence Interval will be given in unit 5).
Now, which of the following two examples is inferential statistics?
Variation is an inevitability facet of life! Every process has variation, every measurement, and every sample. Managers need to understand variation for two key reasons. First, they can lead others to apply statistical thinking in day to day activities and secondly, to apply the concept for the purpose of continuous improvement. High variation means low quality. The aim of this course is to provide you with hands-on experience to promote the use of statistical thinking and techniques to apply them to make educated decisions whenever you encounter variation in business data. You will learn how to think statistically, and effective techniques to intelligently assess and manage the risks inherent in good decision- making. Therefore remember that:
Just like weather, if you cannot control something, you should learn how to measure and analyze in order to predict it, effectively.
Remember also that data are only crude information and not knowledge by themselves. The sequence from data to knowledge is: from Data to Facts, from Facts to Statements, and finally, from statements to knowledge. That's why we need statistical data analysis. Statistics arose from the need to place knowledge on a systematic evidence base for prediction in order to avoid surprises. This required a study of the laws of probability to extend our knowledge from a sample to the whole population with some certainty.
Carefully planned statistical studies remove hindrances to high quality and productivity at every stage of production, saving time and money. It is well recognized that quality must be engineered into products as early as possible in the design process. One must know how to use carefully planned, cost-effective experiments to improve, optimize and make robust products/services and processes.
Read Ch (1-2), and your lecture notes, then write a two-page essay (format-free) entitled: "What Is Business Statistics?"
Your essay should, among others, address the following questions:
There's nothing much in Ch (1-2) to challenge you. It is an attempt to orient you to the subject of Business Statistics.
As a part of your learning enhancement, compare your essay with those listed at the end of this page.
Warnings:
- You have to send me your own solution. DO NOT submit the solution done by your classmate(s). Submitting any posted solution has zero value.
- Doing your homework by Excel implementation alone is not complete. You must do and show your hand computations too. In your Exam you are not allowed to use Excel or any computer software.
Collaborative Learning: It is a fact that we learn from each other, and it is good to rub and polish our mind against that of others.
Sample of Solutions:
Here is is a complete sample. Here is a sample of Essay
Homework 2: Descriptive Statistics
Decision makers make better decisions when they use all available information in an effective and meaningful way. The primary role of statistics is to provide decision makers with methods for obtaining and analyzing information to help make these decisions. Statistics is used to answer long-range planning questions, such as when and where to locate facilities to handle future sales.
I would also like to help you to understand conceptually the meanings of measures of locations of the central tendency, e. g. mean, median, and mode, and measures of variability, e. g., range, variance, standard deviation, and coefficient of variation.
The problem most decision makers must solve is how to deal with the uncertainty that is inherent in almost all aspects of their jobs. Raw data provide little, if any, information to the decision makers. Thus, they need a means of converting the raw data into useful information. In this lecture, we will concentrate on some of the frequently used methods of presenting and organizing data.
When you successfully complete this unit, you will be able to cite examples to show the importance of data and statistical summary measures in business. You will be able to use alternative methods and measures to describe sets of data so that the phenomena they represent can be more easily understood. You will be able to enter data, use the Web-based statistical computation functions to obtain descriptive statistics, and interpret results. You will be able to identify the formulas used by the Web-based computer to make calculations and perform simple calculations with those formula on a hand held calculator using the raw (or original) individual values. You will also be expected to recognize when data transformations are needed before attempting to represent magnitudes with the standard measures of location and dispersion.
E-Labs and Computational Tools:
You are encouraged to select a few JavaScript from the collection under E-Labs and Computational Tools that can be applied to the current topics and then perform some numerical experiment for deeper understanding of the business statistical concepts. For example, you may like checking your hand-computations for the homework problem(s), or checking the numerical examples from your textbook. Submit along with the rest of your homework, a short report entitle "Computer Assignments" describing your findings. As a stating point, I suggest the following JavaScript:
OR
Use Excel to perform your few computer implementation. Excel More Examples.
Types of Statistical Analyses:
Statistical Population: A statistical population is the collection of all possible observations with a specified characteristic of interest. An example is all of the students in the OPRE 504 course during this semester. Note that a sample is a subset of the population.
Variable: A variable is an item of interest that can take on many different values.
Types of Variables or Data:
Types of Quantitative Data: There are four types of quantitative data: Nominal, Ordinal, Interval, and Ratio [taking the first letter of each word, NOIR which is a French word for color black; most students find NOIR easy to remember].
The main difference between ordinal data and nominal data is that ordinal data contain both an equality (=) and a greater-than (>) relationship, whereas the nominal data contain only an equality (=) relationship.
Interval data are preferred over ordinal data because, with them, decision makers can precisely determine the difference between two observations; i.e., distances between numbers can be measured. For example, frozen-food packagers have daily contact with a common interval measurement--temperature.
Information can be collected in statistics from qualitative or quantitative data.
Qualitative data, such as eye color of a group of individuals, is not computable by arithmetic relations. They are labels that advise into which category or class an individual, object, or process falls. They are called categorical variables.
Quantitative data sets consist of measures that take numerical values for which descriptions such as means and standard deviations are meaningful. They can be put into an order and further divided into two groups: discrete data or continuous data. Discrete data, are countable data; for example, the number of defective items produced during a day's production. Continuous data, when the variables are measurable, is expressed on a continuous scale, for example, when you measure the height of a person.
Data are called "primary type" data if the analyst has been involved in collecting the data relevant to his/her investigation. Otherwise, it is called "secondary type" data.
Data come in the forms of Nominal, Ordinal, Interval and Ratio. Data can be either continuous or discrete.
The zero point in an Interval scale is arbitrary. The categorical variable is measured on an ordinal or nominal scale.
Since statisticians live for precision, they prefer Interval/Ratio levels of measurement.
Questions for you:
True/False: Political Affiliation is measured on a nominal scale with Republican = 1, Democrat = 2, and Independent = 3. Independents have greater political affiliation than do either Democrats or Republicans.
True/False: Rank in High School Graduating Class is measured by assigning a 1 to the student with the highest GPA, a 2 to the next highest, and so on. Sylvia's rank is 41; Arthur's is 64. Sylvia had a better grade point average in high school than did Arthur.
True/False: The high temperature in Phoenix, AZ on September 12, 1994 was 104 degrees; the high temperature in Minneapolis, MN on the same day was 52 degrees. On that day, Phoenix was twice as hot as Minneapolis.
True/False: When I was 14 years old, I ran a 100-yard dash in 11.1 seconds; now, at age 60, I can run 100 yards in about 22 seconds (with a tail wind). I could run twice as fast at age 14 as at age 60.
Sources of Data:
An example: statistical abstract of USA. Advantage: less expensive. Disadvantage: may not satisfy your needs.
The easiest method of organizing data is a frequency distribution, which converts raw data into a meaningful pattern for statistical analysis.
The following are the steps of constructing a frequency distribution:
W = (L - S) / K,
where: W = class width, L = the largest data, S = the smallest data, K = number of classes
Example: Suppose the age of a sample of 10 students are:
20.9, 18.1, 18.5, 21.3, 19.4, 25.3, 22.0, 23.1, 23.9, and 22.5
We select K = 4 and W = (25.3 - 18.1)/4 = 1.8 which is rounded-up to 2. The frequency table is as follows:
|
|
Frequency | Relative | Cumulative |
|
|
|
|
|
| 20 Under 22 |
|
|
|
| 22 Under 24 |
|
|
|
| 24 Under 26 |
|
|
|
Note that the sum of all of the relative frequency must always be equal to 1.00 or 100%. In the above example, we see that 40% of all students are younger than 24 years old, but older than 22 years old. Relative frequency may be determined for both quantitative and qualitative data and is a convenient basis for the comparison of similar groups of different size.
What Frequency Distribution Tells:
(1) It shows how the observations cluster around a central value, and
(2) It shows the degree of difference between observations.
For example, in the above problem we know that no student is younger than 18, and the age below 24 is most typical. The most common age is between 22 an 24, which from general information, we know to be higher than usual for the students who enter college right after high school and graduate about age 22. The students in the sample are generally older. It is possible that the population is made up of night students who work on their degrees on a part-time basis while holding full-time jobs. This descriptive analysis provides us with an image of the student sample, which is not available from raw data. As we will see later, frequency distribution is the basis for probability theory.
Cumulative Frequency Distribution: When the observations are numerical, cumulative frequency is used. It shows the total number of observations which lie above or below certain key values. Cumulative Frequency for a population = frequency of each class interval frequencies of preceding intervals. For example, the cumulative frequency for the above example is: 3, 5, 9, and 10.
Presenting Data: Graphs, curves, and charts are used to present data. Bar charts are used to graph the qualitative data. The bars do not touch, indicating that the attributes are qualitative categories; variables are discrete and nor continuous.
Histograms are used to graph absolute, relative, and cumulative frequencies.
Number of Class Intervals in a Histogram: Before we can construct our frequency distribution we must determine how many classes we should use. This is purely arbitrary, but too few classes or too many classes will not provide as clear a picture as can be obtained with some more nearly optimum number. An empirical rule, known as Sturge's Rule, may be used as a useful guide to the number of classes (k) is given by
where k is the number of classes, Log is the logarithmic function (base 10), and and n is the total number of the numerical values which comprise the data set.
Therefore, class width is:
where n is the total number of items in the data set.
To have an "optimum" you need some measure of quality - - presumably in this case, the "best" way to display whatever information is available in the data. The sample size contributes to this; so the usual guidelines are to use between 5 and 15 classes, with more classes possible if you have a larger sample. You take into account a preference for tidy class widths, preferably a multiple of 5 or 10, because this makes it easier to appreciate the scale.
Beyond this it becomes a matter of subjective judgment. Try out a range of class widths and choose the one that works best. (This assumes you have a computer and can generate alternative histograms fairly readily).
There are often management issues that come into it as well. For example, if your data is to be compared to similar data - such as prior studies, or from other countries - - you are restricted to the intervals used therein.
If the histogram is very skewed, then unequal classes should be considered. Use narrow classes where the class frequencies are high, wide classes where they are low.
The following approaches are common:
Let n be the sample size, then the number of class intervals could be
For example, for 200 observations you would use 14 intervals but for 2000 you would use 33.
Alternatively,
Empirical Distribution Function, known also as Ogive is also used to graph cumulative frequency. An ogive is constructed by placing a point corresponding to the upper end of each class at a height equal to the cumulative frequency of the class. These points then are connected.
Pie chart is often used in newspapers and magazines to depict budgets and other economic information (Economists use Pie, while Politicians use Cake). A complete circle (the pie) represents the total number of measurements. The size of a slice of a pie is proportional to the relative frequency of a particular category. For example, since a complete circle is equal to 360 degrees, if the relative frequency for a category is 0.40, the slice assigned to that category is 40% of 360 or (0.40)(360)= 144 degrees.
Pareto chart is a special case of bar chart that is often used in quality control. The purpose of this chart is to show the key causes of unacceptable quality. Each bar in the chart shows the degree of quality problem for each variable measured.
Time series graph is a graph in which the X-axis shows time periods and the Y-axis shows the values related to these time periods.
Stem-and-leaf plots offer another method for organizing raw data into groups. These types of plots are similar to the histogram except that the actual data are displayed instead of bars. The stem-and-leaf is developed by first determining the stem and then adding the leaves. The stem contains the higher-valued digits and the leaf contains the lower-valued digits. For example, the number 78 can be represented by a stem of 7 and a leaf of 8.
Steps to Construct a Stem and Leaf Plot:
Thus, the numbers 34, 32, 36, 20, 20, 22, 54, 55, 52, 68, and 63 can be grouped as follows:
Example: Applying the above steps to our data, we have the following Stem & Leaf:
Stem...............Leaf
2....................0..0..2
3....................2..4..6
4
5....................2..4..5
6....................3..8
How to Construct a BoxPlot? A boxplot is a graphical display that has four characteristics. It shows a measure of central location (the median). It shows a measure of dispersion (the interquartile range, IQR). It includes the presence of possible outliers. And it also gives an indication of the symmetry or skewness of the distribution.
Steps to Construct a BoxPlot:
Measures of location give information about the location of the central tendency within a group of numbers. The measures of location presented in this unit for ungrouped (raw) data are the mean, the median, and the mode.
Arithmetic Mean: The arithmetic mean (or the average or simple mean) is computed by summing all numbers in an array of numbers and then dividing by the number of observations in the array.
For example, to compute the arithmetic mean of a sample, consider the following array of numbers: 19, 20, 21, 23, 18, 25, and 26. First sum the numbers: (19 + 20 + 21 + 23 + 18 + 25 + 26) = 152, and then calculate the sample mean by dividing this total (152) by the number of observations (7), which gives a mean of 21.7 or about 22.
The mean uses all of the observations, and each observation affects the mean. Even though the mean is sensitive to extreme values; i.e., extremely large or small data can cause the mean to be pulled toward the extreme data, it is still the most widely used measure of location. This is due to the fact that the mean has valuable mathematical properties that make it convenient for use with inferential statistical analysis. For example, the sum of the deviations of the numbers in a set of data from the mean is zero, and the sum of the squared deviations of the numbers in a set of data from the mean is the minimum value.
Weighted Mean: In some cases, the data in the sample or population should not be weighted equally; rather each value should be weighted according to its importance. For example, suppose I want to find my average in a course, when the exams are weighted as follows:
| First Test | 100 Points |
|
| Second Test | 100 Points |
|
| Third Test | 100 Points |
|
| Final Test | 100 Points |
|
| Assignments | 50 Points |
|
| Total Points | 450 Points |
|
Suppose I earned 90, 71, 87, 77, and 40 on the first test; second test; third test; and final exam, and the assignments, respectively. My average in that course is calculated as follows:
[0.15(90) + 0.20(71) + 0.30(87) + 0.30(77) + 0.05(40) ] / (0.15 + 0.20 + 0.20 + 0.30 + .05) = 76.55, or 77 points.
Median: The median is the middle value in an ordered array of observations. If there is an even number of observations in the array, the median is the average of the two middle numbers. If there is an odd number of data in the array, the median is the middle number. For example, suppose you want to find the median for the following set of data:
First, we arrange the data in an ordered array:
Since there is an even number of data, the average of the middle two numbers 69 and 70 is the median (139/2) = 69.5.
Generally, the median provides a better measure of location than the mean when there are some extremely large or small observations; i.e., when the data are skewed to the right or to the left. For this reason, median income is used as the measure of location for the U.S. household income. Note that if the median is less than the mean, the data set is skewed to the right. If the median is greater than the mean, the data set is skewed to the left. Median does not have important mathematical properties for use in future calculations.
Mode: The mode is the most frequently occurring value in a set of observations. For example, given 2, 3, 4, 5, 4, the mode is 4, because there are more fours than any other number. Data may have two modes. In this case, we say the data are bimodal, and sets of observations with more than two modes are referred to as multimodal. Note that the mode does not have important mathematical properties for future use. Also, the mode is not a helpful measure of location, because there can be more than one mode or even no mode.
Whenever there is more than one mode, then the population from which the sample came is a mixture of more than one population. All statistical analyses assume that the population is homogeneous meaning that it is unimodal.
Statistical measures of variation are numerical values that indicate the variability inherent in a set of data measurements. The four most common measures of variation are the range, variance, standard deviation, and coefficient of variation.
Measures of variability represent the dispersion of a set of data. For example, let's go back to the example of my tests:
I earned 90, 71, 87, 77, and 40 on first test, second test, third test, final exam, and the assignments, respectively. Remember that my average in the course was 77. What does this average score mean to me? Should I be satisfied with this information? Measure of location (the mean, in this case) does not produce or grant sufficient or adequate information to describe the data set. What is needed is a measure of variability of the data. Note that a small value for a measure of dispersion indicates that the data are concentrated around the mean; therefore, the mean is a good representative of the data set. On the other hand, a large measure of dispersion indicates that the mean is not a good representative of the data set. Also, measures of dispersion can be used when we want to compare the distributions of two or more sets of data. In this unit we will learn about range, variance, standard deviation, and coefficient of variation for ungrouped, or raw, data.
Range: The range of a set of observations is the absolute value of the difference between the largest and smallest values in the set. It measures the size of the smallest contiguous interval of real numbers that encompasses all of the data values.
Example: Given the following sorted data:
1.2, 1.5, 1.9, 2.4, 2.4, 2.5, 2.6, 3.0, 3.5, 3.8
The range of this set of data is 3.8 - 1.2 = 2.6.
Variance: An important measure of variability is variance. Variance is the average of the squared deviations of each observation in the set from the arithmetic mean of all of observations.
Steps to Calculate the Variance:
For example, suppose that the height (in inches) of a sample of students at UB is as follows: 66, 73, 68, 69, and 74. Following the above steps, the variance is calculated as follows: The sum of the height of each student is 350 inches, and the arithmetic mean = (350)/(5) = 70 inches.
| Height |
|
Squared Deviation |
|
|
66 - 70 = -4 |
|
|
|
73 - 70 = 3 |
|
|
|
68 - 70 = -2 |
|
|
|
69 - 70 = -1 |
|
|
|
74 - 70 = 4 |
|
The sum of squared deviations from the mean is = 46 and variance = (46)/(5-1) = 11.5 square inches.
As you see in the above example, the variance is not expressed in the same units as the observations. The observations are in inches, the variance is in square inches. In other words, the variance is hard to understand because the deviations from the mean are squared, making it too large for logical explanation. This problem can be solved by working with the square root of the variance, which is called the standard deviation.
Standard Deviation: Both variance and standard deviation provide the same information; one can always be obtained from the other. In other words, the process of computing a standard deviation always involves computing a variance. Since standard deviation is the square root of the variance, it is always expressed in the same units as the raw data. For example, in the above problem the variance was 11.5 square inches. The standard deviation is the square root of 11.5 which is equal to 3.4 inches (expressed in same units as the raw data).
Meaning of Standard Deviation: One way to explain the standard deviation as a measure of variation of a data set is to answer questions such as how many measurements are within one, two, and three standard deviations from the mean. To answer questions such as this, we need to refer to the empirical rule. The following rule presents guidelines to help answer the question, How many measurements fall within one, two, and three standard deviations?
Empirical Rule: This rule generally applies to mound-shaped data, but specifically to the data that are normally distributed; i.e., bell-shaped. The rule is as follows:
Approximately 68% of the measurements (data) will fall within one standard deviation of the mean, 95% fall within two standard deviations, and 97.7% (or almost 100% ) fall within three standard deviations from the mean.
For example, in the height problem, the mean height was 70 inches with a standard deviation of 3.4 inches. Thus, 68% of the heights fall between 66.6 and 73.4 inches, one standard deviation, i.e., (mean 1 standard deviation) = (70 3.4) = 73.4, and (mean - 1 standard deviation) = 66.6. Ninety five percent (95%) of the heights fall between 63.2 and 76.8 inches, two standard deviations. Ninety nine and seven tenths percent (99.7%) fall between 59.8 and 80.2 inches, three standard deviations.
Skewness: Skewness is a measure of the degree to which the sample population deviates from symmetry with the mean at the center. It will take on a value of zero when the distribution is a symmetrical curve. A positive value indicates the observations are clustered more to the left of the mean with most of the extreme values to the right of the mean. A negative skewness indicates clustering to the right.
Kurtosis: Kurtosis is a measure of the relative peakedness of the curve defined by the distribution of the observations. Standard normal distribution will have a kurtosis of zero. A positive kurtosis indicates the distribution is more peaked than a normal distribution. A negative value means that the distribution is flatter than the standard normal distribution.
Z-Score: How many standard deviations a given point (i.e. observations) is above or below the mean. In other words, a Z-score represents the number of standard deviations an observation (X) is above or below the mean. The larger the Z value, the further away a value will be from the mean. Note that values beyond three standard deviations are very unlikely. Note that if a Z score is negative, the observation (X) is below the mean. If the Z score is positive, the observation (x) is above the mean. The Z score is found by using the following relationship:
Z = (a given value - mean) /standard deviation
For example, for a data set with a mean of 25 and a standard deviation of 5, you want to find out the Z score for a value of 35. This value (X = 35) is 10 units above the mean, with a Zvalue of:
This Z score shows that the raw score (35) is two standard deviations above the mean. Would you be pleased with a grade in this course that is 2 standard deviations above the mean of the class?
Therefore, the Z-score of an observation xi, taken from a population with mean m and standard deviation s, is denoted by Z and is calculated as follows:
The Z score is a measure of the number of standard deviations that an observation is above or below the mean. Since s is never negative, a positive Z score indicates that the observation is above the mean, a negative Z score indicate that the observation is below the mean. Note that Z is a dimensionless value, and is therefore a useful measure by which to compare data values from two different populations even those measured by different units.
Coefficient of Variation: Standard deviation measures the variation in a set of data. For distributions having the same mean, the distribution with the largest standard deviation has the greatest variation. But when considering distributions with different means, decision-makers cannot compare the uncertainty in distribution only by comparing standard deviations. In this case, the coefficient of variation is used; i.e., the coefficients of variation for different distributions are compared, and the distribution with the largest coefficient of variation value has the greatest relative variation.
The coefficient of variation is used in science to represent the relationship of the standard deviation to the mean, telling scientists how representative the mean is of the numbers from which it came. It expresses the standard deviation as a percentage of the mean; i.e., it reflects the variation in a distribution relative to the mean:
Coefficient of Variation(C.V.) = 100 (standard deviation / mean) %
For example, John teaches two sections of statistics. He gives each section a different test covering the same material. The mean score on the test for the day section is 27, with a standard deviation of 3.4. The mean score for the night section is 94 with a standard deviation of 8.0. Which section has the greatest variation or dispersion of scores?
Day Section....................Night Section
Mean.......27.....................94
S.D..........3.4....................8.0
Comparison of the two standard deviations shows that the night section has the greatest variation. But comparing the coefficient of variations (C.V.) shows quite different results:
C.V.(day) = (3.4/27) x 100 = 12.6% and C.V.(night)= (8/94) x 100 = 8.5%
Thus, based on the size of the coefficient of variation, Mark finds that the night section test results have a smaller variation relative to its mean than do the day section test results.
A Short Discussion on Statistical Measures:
Average by itself is not a good indication of quality. You need to know the variance to make any educated assessment. We are reminded of the dilemma of the six-foot tall statistician who drowned in a stream that had an average depth of three feet.
Deviations about the mean m of a population is the basis for most of the statistical tests we will learn. Since we are measuring how much a set of scores is dispersed about the mean m , we are measuring variability. We can calculate the deviations about the mean m and express it as variance s2 or standard deviation s. It is very important to have a firm grasp of this concept because it will be a central concept throughout the course.
Both variance s2 and standard deviation s measure variability within a distribution. Standard deviation s is a number that indicates how much on average each of the values in the distribution deviates from the mean m (or center) of the distribution. Keep in mind that variance s2 measures the same thing as standard deviation (dispersion of scores in a distribution) s. Variance s2, however, is the average squared deviations about the mean m . Thus, variance s2 is the square of the standard deviation s.
Expected value and variance of xbar are: m, and s2/n, respectively.
Expected value and variance of sample variance S2 are: s2 and 2s4/(n-1), respectively.
xbar and S2 are the best estimators for m and s2. They are Unbiased (you may update your estimate), Efficient (they have the smallest variation among other estimators), Consistent (increasing sample size provides a better estimate), and Sufficient (you do not need to have the whole data in details, what you need are Sxi and Sxi2 for estimations).
The coefficient of variation (C.V.) of the population is the relative deviation with respect to size; i.e. C.V. = s /m. It is independent of the unit of measurement. In estimation of a parameter when C.V. is less than say 10%, the estimate is assumed acceptable.
Suppose you have the following, n = 10, data:
a. for the "input range" enter "A1:Dn", assuming you typed the data into cells A1 to An.
b. click on the "output range" button and enter the output range "C1:C16".
c. click on the Summary Statistics box
d. finally, click on "Okay."
The Central Tendency:
The data can be sorted in ascending order:
The mean, median and mode are computed as follows:
The mode is 2.4, since it is the only value that occurs twice.
The midrange is (1.2 + 3.8) / 2 = 2.5.
Note that the mean, median and mode of this set of data are very close to each other. This suggests that the data is very symmetrically distributed.
Variance: The variance of a set of data is the average of the cumulative measure of the squares of the difference of all the data values from the mean.
The sample variance-based estimation for the population variance are computed differently. The sample variance is simply the arithmetic mean of the squares of the difference between each data value in the sample and the mean of the sample. On the other hand, the formula for an estimate for the variance in the population is similar to the formula for the sample variance, except that the denominator in the fraction is (n-1) instead of n. However, you should not worry about this difference if the sample size is large, say over 30. Compute an estimate for the variance of a population, given the following sorted data:
mean = 2.48 as computed earlier. An estimate for the population variance is:
s2 = ( 1 / (10-1)) ( (1.2 - 2.48)2 + (1.5 - 2.48)2 + (1.9 - 2.48)2 + (2.4 -2.48)2 + (2.4 - 2.48)2 + (2.5 - 2.48)2 + (2.6 - 2.48)2 + (3.0 - 2.48)2 + (3.5 -2.48)2 + (3.8 - 2.48)2 )
= (1 / 9) (1.6384 + 0.9604 + 0.3364+ 0.0064 + 0.0064 + 0.0004 + 0.0144 + 0.2704 + 1.0404 + 1.7424)
= 0.6684
Therefore, the standard deviation is s = ( 0.6684 )1/2 = 0.8176
Read Chapter 2, and Ch. 3 Sections 3.1, 2, 3, 4.
Do Problems 2.19, 2.36, 2.51, 2.52 , and 3.3, 3.27, 3.37 Correct solutions worth 100%.
Notice that, as you have read these chapters, you might realized that at the end of each section within a chapter there are a set of exercises (problems) listed numerically, within these numerical system the problem number increases when you go to the next section within the chapter till the end of that chapter. For example the assignment problem 3.27 is problem number 27 located within chapter 3.
As a part of your learning enhancement, compare your essay with those listed at the end of this page.
Warnings:
- You have to send me your own solution. DO NOT submit the solution done by your classmate(s). Submitting any posted solution has zero value.
- Doing your homework by Excel implementation alone is not complete. You must do and show your hand computations too. In your Exam you are not allowed to use Excel or any computer software.
Collaborative Learning: It is a fact that we learn from each other, and it is good to rub and polish our mind against that of others.
Sample of Solutions:
Here is the sample solution to the problems (in Word.Doc). Here is another one. Yet Here is another one.
An E-Lab is Here An Excel implementation of problem 2.52 is Here
Homework 3: Probability and Expected Values
Probability theory provides a way to find and express our uncertainty in making decisions about a population from sample information. Please, see the Chart given in the first week lecture note for the relevancy of Probability to Statistics.
Any generalization and extension of the results obtained from a random sample to the population contains uncertainties. How do you measure uncertainty? The answer is: By Probability measure.
When you successfully complete this unit, you will be acquainted with the notion of a random variable and the basic rules of probability. You will be familiar with the expected values (means and variances) of a random variable and the sum of random variables. You will be able to articulate the difference between a mean calculated with relative frequencies and probabilities. You will be able to calculate means and standard deviations. You will be able to make applications to business and economics as well as personal financial situations (and in your Finance courses).
Select those JavaScripts from the collection under E-Labs and Computational Tools that can be applied to the current topics and then perform some numerical experiment for deeper understanding of the concepts. For example, you may like checking your hand-computations for the homework problem(s), or checking the numerical examples from your textbook. Submit along with the rest of your homework, a short report entitle "Computer Assignments" describing your findings. As a stating point, I suggest the following JavaScript:
OR
Use Excel to perform your few computer implementation. Excel More Examples.
How is the lottery in Maryland set up so that it will make revenue for the state? Is there any way the state could lose money on a game? Probability theory provides a way to find and express our uncertainty in making decisions about a population from sample information. Probability is a number between 0 and 1. The highest value of any probability is 1. Probability reflects the long-run relative frequency of the outcome. A probability is expressed as a decimal, such as 0.7 or as a fraction, such as 7/10, or as a percentage, such as 70%.
"Probability" has an exact technical meaning. Well, in fact it has several, and there is still debate as to which one ought to be used. However, for most events for which probability is easily computed; e.g. rolling on a die the probability of getting [::], almost all agree on the actual value (1/6), if not the philosophical interpretation. A probability is always a number between 0 and 1.
The word "chance" or "chances" is often used as an approximate synonym of "probability", either for variety or to save syllables. One view is that it would be better practice to leave it for informal use, and say "probability" if that is what is meant.
In cases where the probability of an observation is described by a parametric model, the "likelihood" of a parameter value given the data is defined to be the probability of the data given the parameter. One occasionally sees "likely" and "likelihood", however, these terms are used casually as synonyms for "probable" and "probability".
"Odds" is a probabilistic concept related to probability. It is the ratio of the probability p of an event to the probability (1-p) that it does not happen. It is often expressed as a ratio, often of whole numbers; e.g., "odds" of 1 to 5 in the die example above, but for technical purposes the division may be carried out to yield a positive real number (here 0.2). The logarithm of the odds ratio is useful for technical purposes, as it maps the range of probabilities onto the (extended) real numbers in a way that preserves symmetry between the probability that an event occurs and the probability that it does not.
Another way to compare probabilities and odds is using "part-whole thinking" with a binary (dichotomous) split in a group. A probability is often a ratio of a part to a whole; e.g., the ratio of the part [those who survived 5 years after being diagnosed with a disease] to the whole [those who were diagnosed with the disease]. Odds are often a ratio of a part to a part; e.g., the odds against dying are the ratio of the part that succeeded [those who survived 5 years after being diagnosed with a disease] to the part that 'failed' [those who did not survive 5 years after being diagnosed with a disease].
Obviously, probability and odds are intimately related: Odds = p/(1-p). Note that probability is always between zero and one whereas odds range from zero to infinity.
Aside from their value in betting, odds allow one to specify a small probability (near zero) or a large probability (near one) using large whole numbers (1,000 to 1 or a million to one). Odds magnify small probabilities (or large probabilities) so as to make the relative differences visible. Consider two probabilities: 0.01 and 0.005. They are both small. An untrained observer might not realize that one is twice as much as the other. But if expressed as odds (99 to 1 versus 199 to 1) it may be easier to compare the two situations by focusing on large whole numbers (199 versus 99) rather than on small ratios or fractions.
There are three major approaches of assigning probabilities as follows:
Note that we can apply the classical probability when the events have the same chance of occurring (called equally likely events), and the set of events are mutually exclusive and collectively exhaustive.
Note that relative probability is based on what has happened in the past will happen in the future. For example, your company wants to decide on the probability that its inspectors are going to reject the next batch of raw materials from a supplier. Data collected from your company record books show that the supplier had sent your company 80 batches in the past, and inspectors had rejected 15 of them. By the method of relative probability, the probability of the inspectors rejecting the next batch is 15/80, or 0.19. If the next batch is rejected, the relative probability for the subsequent shipment would change to 16/81 = 0.20.
Experiment:
Experimentation is an activity that is either observed or measured, such as tossing a coin, or drawing a card.
Event (Outcome): An event is a possible outcome of an experiment. For example, if the experiment is to sample six lamps coming off a production line, an event could be to get one defective and five good ones.
Elementary Events: Elementary events are those types of events that cannot be broken into other events. For example, suppose that the experiment is to roll a die. The elementary events for this experiment are to roll a 1 or a 2, and so on; i.e., there are six elementary events (1, 2, 3, 4, 5, 6). Note that rolling an even number is an event, but it is not an elementary event, because the even number can be broken down further into events 2, 4, and 6.
Sample Space: A sample space is a complete set of all events of an experiment. The sample space for the roll of a single die is 1, 2, 3, 4, 5, and 6. The sample space of the experiment of tossing a coin three times is:
Notice that, since each tossing has 2 possible outcomes, therefore, tossing a coin three times, has (2)(2)(2) = 23 = 8 possibilities. All eight possibilities are listed column-wise in the above table. For example, the fourth possibility is that, in the first toss you get T, and the second and the third you get H.
Sample space can aid in finding probabilities. However, using the sample space to express probabilities is hard when the sample space is large. Hence, we usually use other approaches to determine probability.
Unions & Intersections: An element qualifies for the union of X, Y if it is in either X or Y or in both X and Y. For example, if X = (2, 8, 14, 18) and Y = (4, 6, 8, 10, 12), then the union of (X, Y) = (2, 4, 6, 8, 10, 12, 14, 18). The key word indicating the union of two or more events is or.
An element qualifies for the intersection of X, Y if it is in both X and Y.
For example, if X = (2, 8, 14, 18) and Y = (4, 6, 8, 10, 12), then the intersection of(X,Y) = 8. The key word indicating the intersection of two or more events is and.
Mutually Exclusive Events: Those events that cannot happen together are called mutually exclusive events. For example, in the toss of a single coin, the events of heads and tails are mutually exclusive. The probability of two mutually exclusive events occurring at the same time is zero.
Independent Events: Two or more events are called independent events when the occurrence or nonoccurrence of one of the events does not affect the occurrence or nonoccurrence of the others. Thus, when two events are independent, the probability of attaining the second event is the same regardless of the outcome of the first event. For example, the probability of tossing a head is always 0.5, regardless of what was tossed previously.
Note that in these types of experiments, the events are independent if sampling is done with replacement.
Collectively Exhaustive Events: A list of collectively exhaustive events contains all possible elementary events for an experiment. For example, for the die-tossing experiment, the set of events consists of 1, 2, 3, 4, 5, and 6. The set is collectively exhaustive because it includes all possible outcomes. Thus, all sample spaces are collectively exhaustive.
Complementary Events: The complement of an event such as A consists of all events not included in A. For example, when rolling a die, event A is getting an odd number, the complement of A is getting an even number. Thus, the complement of event A contains whatever portion of the sample space that event A does not contain.
Four types of probabilities are discussed in this unit: Marginal Probability, Union Probability, Joint Probability, and Conditional Probability.
There are a few different ways in which probability problems can be solved. These methods include tree diagrams, laws of probability, sample space, insight, and contingency tables. Because of the individuality and variety of probability problems, some approaches apply more readily in certain cases than in others. There is no best method for solving all probability problems.
Three laws of probability are discussed in this unit: the Additive law, the Multiplicative law, and the Conditional law.
1. The Additive Law:
A. General Rule of Addition: When two or more events will happen at the same time, and the events are not mutually exclusive, then:
For example, what is the probability that a card chosen at random from a deck of cards will either be a king or a heart? There are 4 kings and 13 hearts in a deck of cards and 1 king of hearts.
B. Special Rule of Addition: When two or more events will happen at the same time, and the events are mutually exclusive, then:
For example, suppose we have a machine that inserts a mixture of beans, broccoli, and other types of vegetables into a plastic bag. Most of the bags contain the correct weight, but because of slight variation in the size of the beans and other vegetables, a package might be slightly underweight or overweight. A check of many packages in the past indicates that:
|
|
Events | # of Packages | Probability |
|
|
|
|
|
| Correct weight |
|
|
|
| Over weight |
|
|
|
|
|
|
|
|
What is the probability of selecting a package at random having the package under weight or over weight? Since the events are mutually exclusive, a package cannot be underweight and overweight at the same time. The answer is: P(X or Z) = (0.025 + 0.075) = 0.1
2. The Multiplicative Law:
A. General Rule of Multiplication: When two or more events will happen at the same time, and the events are dependent, then the general rule of multiplicative law is used to find the joint probability:
For example, suppose there are 10 marbles in a bag, and 3 are defective. Two marbles are to be selected, one after the other without replacement. What is the probability of selecting a defective marble followed by another defective marble?
This means that if this experiment were repeated 100 times, in the long run 7 experiments would result in defective marbles on both the first and second selections.
B. Special Rule of Multiplicative: When two or more events will happen at the same time, and the events are independent, then the special rule of multiplication law is used to find the joint probability:
If two coins are tossed, what is the probability of getting a tail on the first coin and a tail on the second coin?
This can be shown by listing all of the four possible outcomes: T T, or T H, or H T, or H H. Games of chance in casinos, such as roulette and craps, consist of independent events. The next occurrence on the die or wheel should have nothing to do with what has already happened.
3. The Conditional Law:
Conditional probabilities are based on knowledge of one of the variables. The conditional probability of an event, such as X, occurring given that another event, such as Y, has occurred is expressed as:
Provided P(y) is not zero. Note that when using the conditional law of probability, you always divide the joint probability by the probability of the event after the word given. Thus, to get P(X given Y), you divide the joint probability of X and Y by the unconditional probability of Y. In other words, the above equation is used to find the conditional probability for any two dependent events. When two events, such as X and Y, are independent their conditional probability is calculated as follows:
and
For example, if a single card is selected at random from a deck of cards, what is the probability that the card is a king given that it is a club?
P(king given club) = P (X|Y) = P(X and Y) / P(Y)
P(Y) = 13/52, and P(king given club) = 1/52, thus
P(king given club) = P(X|Y) = (1/52) / (13/52) = 1/13
Note that this example can be solved conceptually without the use of equations. Since there are only 13 clubs in the deck of 52 cards, the probability of a club is 13/52. Of the 13 clubs, only 1 is a king. Thus P(king given club) = 1/13.
Combination Rule: The combination equation is used to find the number of possible arrangements when there is only one group of objects and when the order of choosing is not important. In other words, combinations are used to summarize all possible ways that outcomes can occur without listing the possibilities by hand. The combination equation is as follows:
Where n = total number of objects, x= number of objects to be used at one time, C = number of ways the object can be arranged, and the symbol (!) stands for factorial. Note: 3! = (3)(2)(1)= 6, by convention 0! = 1.
For example, suppose that 4% of all televisions made by a manufacturer are defective. Therefore, P(D) = 0.04, P(G) = 1 - P(D) = 0.96. If eight of these televisions are randomly selected from across the country and tested, what is the probability that exactly three of them are defective? Assume that each television is made independently of the others.
Using the combination equation to enumerate all possibilities yields:
which means there are 56 different ways to get three defects from a total of eight televisions. Assuming D is a defective television and G is a good television, one way to get three defects would be:
Because the televisions are made independently, the probability of getting the first three defective and the last five good is:
which is the probability of getting three defects in the above order. Now, multiplying the 56 ways by the probability of getting one of these ways gives: (56)(0.0000052) = 0.03%, which is the answer for drawing eight televisions and getting exactly three defectives.
In the Next Unit a more detailed procedure for working these types of problems in the discussion of Binomial Distribution.
Exercise What is the probability of having 2 boys and 1 girl, given that P(boy) = .513 and P(girl) = .487?
Random variable: A random variable is a variable whose value is random and numerical. It varies and it is also random.
Examples:
X = number of heads in 4 coin tosses
Y = height of a person randomly selected from population
Z = number of boys in 3 children
Random variables also have probability distributions. That is, although a random variable is random, it follows a special pattern in its occurrence, called a probability distribution. To construct a probability distribution, list all possible outcomes of the random variable and the probability of each occurring.
Types of Random Variables
Why do we need to know about random variables? The answer is, because it enables us to quantify a qualitative outcome. For example, we assign 1 to getting a Heads, and 0 for getting a Tails in tossing a coin.
A Parameter is a number that describes some characteristic of the population. For example mean mis a parameter.
A Statistic is a function of observation. It is a number that is computed from data in a sample. For example Xbar, the sample mean is a statistic
Example: A poll at UB asks which presidential candidate a student favors. If we could ask everyone, we would find 57% favor Candidate A. In a sample of 50 students, 49% favor Candidate A.
Typically, the value of the parameter is unknown. We take one sample and calculate a statistic and use that to estimate the parameter.
Expected Value of a Discrete Random Variable
Exercise: Let X=number of heads in 4 coin tosses. What is the expected number of heads?
Also answer the following questions: How do casinos make money? How do insurance companies make their money?
Law of Large Numbers
If we observe the outcomes of a random variable over and over again and calculate the average of the observed values, this average gets closer and closer to the true mean of the distribution.
We can also define the variance of a discrete random variable:
In what you are learning up-to-now are mostly the symbolic language the other is the keywords and phrases. Both are needed to understand and apply statistical technique for business decision making which is at the heart of this course.
Capital letters such as X often denotes Random Variable, their lower case x are their numerical values based on observations. The ith observation is denoted as xi. Therefore if you have a sample size of n = 3, there you much find out the numerical values of x1, x2, and x3. In more detail:
A random variable assigns a numerical value to each simple event. For example, in sampling for quality control an item could be defective or non-defective, therefore, one may assign X=1, and X = 0 for a defective and non-defective item, respectively. You may assign any other two distinct real numbers, as you wish; however, non-negative integer random variables are easy to work with. Random variables are needed since one cannot do arithmetic operations on words; the random variable enables us to compute statistics, such as average and variance. Any random variable has a distribution of probabilities associated with it.
The word random observation that a value to random variable after a realization (i.e., observation). More formally, an estimate is the ith trail Xi after observing its value it is xi. If I take a sample size of 3, a possible observation, in the context of our example could be [defective, non-defective, defective] or equivalently [ x1 = 1, x2 = 0, x3 = 1], That is a particular value of for the random variable is obtained from a particular sample of data and used to indicate the numerical value of that observation.
Exercise: Newsweek
reported that "average take" for bank robberies was $3,244 but 85 percent of the robbers were caught. Assuming 60 percent of those caught lose their entire take and 40 percent lose half, graph the probability mass function using EXCEL. Calculate the expected take from a bank robbery. Does it pay to be a bank robber?
To construct the probability function for bank robberies, first define the random variable x, bank robbery take. If the robber is not caught, x = $3,244. If the robber is caught and manages to keep half, x = $1,622. If the robber is caught and loses it all, then x = 0. The associated probabilities for these x values are 0.15 = (1 - 0.85), 0.34 = (0.85)(0.4), and 0.51 = (0.85)(0.6). After entering the x values in cells A1, A2 and A3 and after entering the associated probabilities in B1, B2, and B3, the following steps lead to the probability mass function:
The expected return on a bank robbery is positive. On average, bank robbers get $1,038.08 per heist. If criminals make their decisions strictly on this expected value, then it pays to rob banks. A decision rule based only on an expected value, however, ignores the risks or variability in the returns. In addition, our expected value calculations do not include the cost of jail time, which could be viewed by criminals as substantial.
A question for you. Write a few sentences telling me what do you think of the following statement?
"If the probability of someone carrying a bomb on a plane is .001, then the chance of two people carrying a bomb is .000001. Therefore, I should start carrying a bomb on every flight."
Read Ch. 4, and Ch. 5 sections 5.1, 2, 3.
Do Problems 4.3, 4.17, 4.27, and 5.1, 5.19, 5.23.
As a part of your learning enhancement, compare your solutions with those listed at the end of this page.
Warnings:
- You have to send me your own solution. DO NOT submit the solution done by your classmate(s). Submitting any posted solution has zero value.
- Doing your homework by Excel implementation alone is not complete. You must do and show your hand computations too. In your Exam you are not allowed to use Excel or any computer software.
Collaborative Learning: It is a fact that we learn from each other, and it is good to rub and polish our mind against that of others.
Sample of Solutions:
Here is a solution set. Here is a another one.
Homework 4: Review and First Examination
Examine you knowledge by solving: Sample of Questions for the Midterm Examinations
Your test is closed book however you are allowed ONLY to use your own Pre-Prepared Summary-Sheets, you may use a calculator. You need also a Blue Book, i.e. Exam Book, available at the Bookstore, not to use loose papers.
Your test is designed to know how reflective is your statistical mind -- therefore there is a two-hour time limit.
Your test has a total of 110 points for correct answers. The 10 extra points are for any "silly mistakes" that I hope you would not make at all. Any points you earn beyond 100 will be counted toward your final exam.
Review the following summary sheets which include the materials we have covered up to now:
If you think you have prepared a better one, kindly send it to me via an attached email. Thank you.
Review your past assignments. Ask yourself: What have I learned up to now? Your preparation is a very important undertaking in terms of integrating what you have learned each week in order to see the whole picture and inter-connectivity of the topics. Since you are allowed ONLY to use your own Pre-Prepared Summary-Sheets for Exam.
Read thoughtfully the Why List (Word.Doc), containing a set of good questions, asked by your classmates.
I do suggest that you prepare a few pages of your own summary sheets.
Your mind is what your brain does. Self-consciousness is self-knowledge. The process of becoming conscious distributes what you know throughout your brain via the brain neural network branches, unlike memorizing, which connects only two nodes of the network. The availability and expansion of what you know throughout your neural network branches make the information processing of your brain accurate. Thus, you possess a reflective, brilliant knowledgeable mind.
The process of making your own summary sheet is the idea of contemplating the topics you have learned. By definition of esthetics, the longer you contemplate on what you have learned the more beautiful the subject matter becomes. Beauty and contemplation is distinguished from other mental manifestations; contemplation is the result of the perfect apprehension of relations and topics.
Use the following guide to prepare your summary sheets:
The above process helps to crystallize your mind to be reflective and responsive to questions posed about topics you've learned in this course and reinforces the topics in your mind.
I Am Confused: How To Know When To Apply What Formulas And Calculations In Word Problems?
I have received the following honest concern and difficulty from one of your classmates. It will be beneficial to read and apply my recommendations:
..The muddiest points still remaining are how to know when to apply what formulas and calculations in word problems?
You are not alone on this. Since you are learning little-by-little every week, it is a very natural desire to see the wholeness and manifoldness of topics. Therefore, it is natural to feel confused because of accumulation of different topics. However we must cross over to the other side of confusion where by thinking clearly and distinctively you will feel comfortable.
As you know by now, the ingredient components of what you should master are:
To master what you are learning, I recommend you prepare a summary sheet of the main topics you have learned in any given week.
Homework 5: Discrete and Continuous Distributions
A Random Variable is a quantity resulting from a random experiment that, by chance, can assume different values, such as, number of defective light bulbs produced during a week. Also, we said a Discrete random Variable is a variable which can assume only integer values, such as, 7, 9, and so on. In other words, a discrete random variable cannot take fractions as value. Things such as people, cars, or defectives are things we can count and are discrete items. In this unit, we will discuss Binomial distribution which a widely used distribution for discrete random variables.
A Continuous random is a variable can take on any value over a given interval. Continuous variables are measured not counted. Items such as height, weight and time are continuous and can take on fractional values. For example, a basketball player may be 6.954 feet tall.
There are many continuous probability distributions, such as, uniform distribution, normal distribution, the t-distribution, the chi-square distribution, and F distribution. In this unit, we will concentrate on the uniform and normal distributions.
When you successfully complete this unit, you will be able to articulate the difference between probabilities associated with discrete and continuous random variables. You will be able to identify the use of discrete distributions in real and hypothetical situations. You will be able to identify the correct use of specific continuous distributions in real and hypothetical situations. You will know the general properties of the normal and t-distributions, and be aware of the existence and possible use of other continuous distributions like the Chi-square and F. You will be able to use available Web-based tools to obtain probabilities from these distributions.
Select those JavaScript that can be applied to the current topics and then perform some numerical experiment for deeper understanding of the concepts. For example, you may like checking your hand-computations for the homework problem(s), or checking the numerical examples from your textbook. Submit along with the rest of your homework, a short report entitle "Computer Assignments" describing your findings. As a stating point, I suggest the following JavaScript:
OR
Use Excel to perform your few computer implementation. Excel More Examples.
Read Ch. 6 sections 6.1-6.4 and Ch. 7.
Do problems 6.1, 6.7, 6.23, 6.27 and 7.15, 7.17, 7.19, 7.23
As a part of your learning enhancement, compare your solutions with those listed at the end of this page.
Warnings:
- You have to send me your own solution. DO NOT submit the solution done by your classmate(s). Submitting any posted solution has zero value.
- Doing your homework by Excel implementation alone is not complete. You must do and show your hand computations too. In your Exam you are not allowed to use Excel or any computer software.
Collaborative Learning: It is a fact that we learn from each other, and it is good to rub and polish our mind against that of others.
Sample of Solutions:
Here is a solution set. Here is another one. Yet another one.
Here is an Excel implementation.
Homework 6: Sampling Distribution and the CLT
You may recall that there are several good reasons for taking a sample instead of conducting a census, for example, to save time, money, etc. Also, in the same lecture we said that if a for example, a marketing researcher is using data gathered on a group to reach conclusions about that same group only, the statistics are called descriptive statistics. For example, if I produce statistics to summarize my class's examination effort and use those statistics to reach conclusions about my class only, the statistics are descriptive. On the other hand, if a researcher collects data from a sample and uses the statistics generated to reach conclusions about the population from which the sample was taken, the statistics are inferential statistics. The data collected are being used to infer something about a large group.
In attempting to analysis the sample statistic, it is essential to know the distribution of the statistic. In this lecture, we are going to talk about the sample mean as the statistic. In order to compute and assign the probability of occurrence of a particular value of a sample mean, we must know the distribution of the sample means. In other words, how are sample means distributed? One way to examine the distribution possibilities is to take a population with a particular distribution, randomly select samples of given size, compute the sample means, and attempt to determine how the means are distributed.
Topics:
Statisticians employ different procedures in choosing the observations that will constitute their random samples of the population. The objective of these procedures is to select samples that will be representative of the population from where they originate. These samples, also known as random samples, will have the property that each item has the same probability of being drawn from the population as another item. There are many ways to collect a sample. The most commonly used methods are: Simple Random Sampling; Stratified Random Sampling; Cluster Sampling; Systematic Sampling; and Non-statistical Sampling.
Example: There are 65,780 different samples of 5 different letters that can be obtained from the 26 letters of the alphabet. If a procedure for selecting a sample of 5 letters was devised such that each of these 65,780 samples had an equal probability (equal to 1/65,780) of being selected, then the sample selected would be a random sample.
Stratified random sampling is the sampling procedure that divides the population under study into mutually exclusive sub-populations and then selects random samples from each of these subpopulations. The subpopulations are determined in such a way that the parameter of interest is fairly homogenous within a sub-population. By doing so, the variability of the population parameter within each sub-population should be considerably less than the variability for the entire population. There is a often relationship between the characteristics of a certain population and the population parameter.
Example: In determining the distribution of incomes among engineers in the Eastern Shore, we can divide the population of engineers into sub-populations corresponding to each major engineering specialty (electrical, chemical, mechanical, civil, industrial, etc.). Random samples can then be selected from each of these sub-populations of engineers. The logic behind this sampling structure is the reasonable assumption that the income of an engineer depends, to a large extent, on his particular specialty.
To use stratified random sampling, we would again need the list of households. A less expensive way is to let each block within the city represent a cluster. A sample of clusters could then be randomly selected, and every household within these clusters could be interviewed to find the average annual household income.
Once again, cluster sampling is the sampling procedure that randomly selects clusters of observations from the population under study, and then chooses all, or a random selection, of the elements of these clusters as the observations of the sample. Often, cluster sampling is a cost-efficient procedure for selecting a sample representative of the population; this is especially true for a widely scattered population.
Example: In conducting a poll of voter preferences for a statewide election, we can randomly select congressional districts (or some other applicable grouping of voters), and then conduct the poll among the people in the chosen congressional district. Many voter polls that utilize cluster sampling carefully choose their clusters so that they best represent the voter preferences for the whole state.
Example: In inspecting a batch of 1,000 pipes for defects, we can choose to inspect every 10th item in the batch. The items inspected are the 10th, 20th, 30th, and so on until the 1000th item. In so doing, we must ensure that each 10th item is not specially produced by a special process or machine; otherwise, the proportion of defects in the sample consisting of every 10th item will be fairly homogenous within the sample, and the sample will not be representative of the entire batch of 1,000 pipes.
Other Sampling Methods:
In attempting to analysis the sample statistic, it is essential to know the distribution of the statistic. In this unit, we are going to present the sample mean as the statistic. In order to compute and assign the probability of occurrence of a particular value of a sample mean, we must know the distribution of the sample means. In other words, how are sample means distributed? One way to examine the distribution possibilities is to take a population with a particular distribution, randomly select samples of a given size, compute the sample means, and attempt to determine how the means are distributed.
Example: Suppose that in a company the retirement fund is invested in five corporate stocks with the following returns:
|
|
|
|
|
|
|
|
|
|
|
|
|
|
|
|
|
|
In this example, the population mean is equal to 8%, and the population standard deviation is equal to 8.15%. Now, suppose that we decide to take a random sample of three stocks. Assuming that the order is not important and sampling is done without replacement, applying combination equation (n = 5, and x = 3) there are ten possibilities:
|
|
|
|
|
|
|
|
|
|
|
|
|
|
|
|
|
|
|
|
|
|
|
|
|
|
|
|
|
|
|
|
|
|
|
|
|
|
|
|
|
|
|
|
As the above example shows, two (or more) samples from the same population will likely have different sample values (mean values range from 2.33% to 13.33%), and therefore possibly lead to different decisions. Thus, the sample mean reported to the decision maker in the company will depend on the sample selected; i.e., sample 1, 2, 3,.....or 10. . Notice that the samples? mean (column 3 in the above table) are different from the population mean; i.e., 8, as one expect from a small random sample. For example, if sample 4 is selected, the sampling error (the difference between a sample statistic and its corresponding population parameter) is fairly small (8.33 - 8.0 = 0.33), but if the selected sample is sample 2, the error is quite large (13.33 - 8.0 = 5.33). Because the decision maker cannot know how large the sampling error will be before selecting the sample, he/she should know how the possible sample means are distributed.
The distribution of all possible sample means and their related probability is called the sampling distribution of the means.
Properties of the Sampling Distribution of Means: If a population is normally distributed, then:
For example, from the above table, the mean of the means is equal to 8% which is same as the population mean, and standard error of the mean is equal to 3.26% which is less than the population standard deviation of 8.15%.
If a random sample of n observations is selected from any population, then, when the sample size is sufficiently large (n >30) the sampling distribution of the mean tends to approximate the normal distribution. The larger the sample size, n, the better will be the normal approximation to the sampling distribution of the mean.
In general, it can be shown that the mean of the sample means is the same as the population mean, and the standard error of the mean is smaller than the population standard deviation.
The real advantage of the central limit theorem is that sample data drawn from populations not normally distributed or from populations of unknown shape also can be analyzed by using the normal distribution, because the sample means are normally distributed for sample sizes of n>30.
Note that the distribution of the sample means begins to approximate the normal curve as the sample size, n, gets larger.
Since the central limit theorem states that sample means are normally distributed regardless of the shape of the population for large samples and for any sample size with normally distributed population, sample means can be analyzed by using Z scores.
Example: You are the Director of Transportation Safety for the state of Maryland. You are concerned because the average highway speed of all trucks may exceed the 60 miles per hour (mph) speed limit. A random sample of 120 trucks show a mean speed of 62 mph. Assuming that the population mean is 60 mph and population standard deviation is 12.5 mph, find the probability that average speed greater than or equal to 62 mph.
In this problem, n = 120, the mean of the means = population mean = 60 mph, and standard error of the mean = population standard deviation /square root of sample size = 12.5/10.95 = 1.14. Plugging these numbers into the Z score equation, we get,
From the standard normal distribution table, this Z value yields a probability of 0.4599. This is the probability of getting a mean between 62 mph and the population's mean 60 mph. Therefore, the probability of getting a sample average speed grater than 62 mph is (0.5 - 0.4599) = 0.04. That is, 4% of the time, a random sample of 120 trucks from the population will yield a mean speed of 62 mph or more.
Notes: If the variable being measured is normally distributed to begin with, then the requirement n >30 can be waived, and all the results of the theorem still hold. However, if the variable being measured has a highly skewed distribution, then the requirement n >30 may not be adequate to guarantee a normal distribution. You may need a sample in excess of 50 or more. Highly skewed distributions are dangerous and should be regarded with caution. Fortunately, in many applications, they are not very common.
Example: Suppose you take samples of size 64 from a population whose mean is 500 and whose standard deviation is 100. Then the distribution of the means will be normally distributed with a mean m = 500 and a standard error of the mean will be 100 divided by the square root of 64, that is 12.5.
Application: Suppose a manufacturer claims that his production line produces tires with a mean tread life of 40,000 and a standard deviation of 500 miles. We draw a sample of 100 tires and find a sample average of 39,850. Know that we should expect some variation, if that sample average unusually high or a reasonable variation from the claimed mean.
The mean of all similar sample averages will be, according to the Central Limit Theorem, the same as the mean of the individual tires, in this case, 40,000. The standard error of the means will be the old standard deviation divided by the square root of the sample size, or 500/10 = 50, where 10 is the square root of 100. Hence, our sample mean of 39850, is 39850 - 40000, or 150 units below the mean. But that is 150/50 = 3.00 standard deviations away from the mean. We know that hardly ever does a value from a normal distribution land that far away from the mean. We think we have cause to worry about these tires.
Example: A bakery sells an average of 24 loaves of bread per day. Sales (x) are normally distributed with a standard deviation of 4.
Solution:1. The sampling distribution of the sample mean xbar is normal with a mean of 24 and a standard error of the mean of 4. Thus, using Excel, 0.15866 =1-NORMDIST(28,24,4,1).
2. The sampling distribution of the sample mean xbar is normal with a mean of 24 and a standard error of the mean of 2 using Excel, 0.02275 =1-NORMDIST(28,24,2,1).
Select those JavaScripts from the collection under E-Labs and Computational Tools that can be applied to the current topics and then perform some numerical experiment for deeper understanding of the concepts. For example, you may like checking your hand-computations for the homework problem(s), or checking the numerical examples from your textbook. Submit along with the rest of your homework, a short report entitle "Computer Assignments" describing your findings. As a stating point, I suggest the following JavaScript:
OR
Use Excel to perform your few computer implementation. Excel More Examples.
Read Ch. 8.
Do problems 8.1, 8.5, 8.7, 8.11, 8.17, 8.35, 8.47, 8.51
As a part of your learning enhancement, compare your solutions with those listed at the end of this page.
Warnings:
- You have to send me your own solution. DO NOT submit the solution done by your classmate(s). Submitting any posted solution has zero value.
- Doing your homework by Excel implementation alone is not complete. You must do and show your hand computations too. In your Exam you are not allowed to use Excel or any computer software.
Collaborative Learning: It is a fact that we learn from each other, and it is good to rub and polish our mind against that of others.
Sample of Solutions:
Here is a solution set, Here is another one, Yet another, submitted by your classmates.
Here is an Excel implementation for problem 8.51.
Homework 7: Statistical Inference
In the previous unit, our discussion partly was on sampling from a population, we have known the population, and calculated the chance (exact or approximate) that, for example, the average of the sample would be in some range. That is, a probability calculation.
We also learnt, how to construction of confidence intervals for population parameters (mean and variance), which is working backwards from a sample to population, or to infer something about the population, of course, subject to some uncertainty. This is one of the most important and fundamental problems statistics addresses: how to estimate and make inferences about a parameter of a population based on a random sample taken from the population, using a CORRECT statistical method.
Because the value the estimator takes depends on the sample, the estimator's value is random, and will not typically equal the value of the population parameter. We need to understand how the value of the estimator varies for different possible samples to be able to say how close or how far from the parameter value the estimator's value is likely to be. That's essentially what a C.I. is for.
Now we turn on to test of hypotheses (claims) about mean and variance of a population or concerning comparison of these parameters for two populations based on random samples.
We learn that there is a duality between the test of hypothesis and construction of confidence interval. That is, instead of performing a test for a claimed value for the population parameter, we may construct a confidence interval, and then see if the constructed confidence interval contained the claimed valued.
Read Ch. 9, and Ch. 10.
Do problems 9.13, 9.15, 9.22, 9.31, 9.53, and 10.9, 10.24, 10.39
As a part of your learning enhancement, compare your solutions with those listed at the end of this page.
Warnings:
- You have to send me your own solution. DO NOT submit the solution done by your classmate(s). Submitting any posted solution has zero value.
- Doing your homework by Excel implementation alone is not complete. You must do and show your hand computations too. In your Exam you are not allowed to use Excel or any computer software.
Collaborative Learning: It is a fact that we learn from each other, and it is good to rub and polish our mind against that of others.
Sample of Solutions:
Here is a solution set, Here is another (with some extra problems) submitted by one of your classmates.
Here is a another one. Yet another one.
Excel implementation for Problem9.31 and for problem 9.53 done by your classmates.
An E-Labs report is here
Homework 8: Analysis of Variance
Read Ch. 11 (sections 11.1).
Do problems 11.3, 11.5
Warnings:
- You have to send me your own solution. DO NOT submit the solution done by your classmate(s). Submitting any posted solution has zero value.
- Doing your homework by Excel implementation alone is not complete. You must do and show your hand computations too. In your Exam you are not allowed to use Excel or any computer software.
Collaborative Learning: It is a fact that we learn from each other, and it is good to rub and polish our mind against that of others.
Sample of Solutions:
Here is a solution set submitted by one of your classmates.
Here is a solution set submitted by another classmates.
Homework 9: Regression, Covariance, and Correlation
Read Ch. 13.
Do problems 13.5, 13.17, 13.25, 13.43, 13.57
As a part of your learning enhancement, compare your solutions with those listed at the end of this page.
Warnings:
- You have to send me your own solution. DO NOT submit the solution done by your classmate(s). Submitting any posted solution has zero value.
- Doing your homework by Excel implementation alone is not complete. You must do and show your hand computations too. In your Exam you are not allowed to use Excel or any computer software.
Collaborative Learning: It is a fact that we learn from each other, and it is good to rub and polish our mind against that of others.
Sample of Solutions:
Here is a solution set submitted by one of your classmates.
Here is a complete solution set submitted by one of your classmates. Another one is Here. Here is yet another one. The Excel version is Here.
Homework 10: Review and Final Examination
Your final is similar to your first test, it is designed to know how reflective is your statistical mind? Therefore, there is a two-hour time limit. You should expect about 15 questions both familiar applications and conceptual type questions.
Your test has a total of 100 points for correct answers, it is closed-book (Except for use of the Statistical Tables), you are allowed ONLY to use your own Pre-Prepared Summary-Sheets for Exam..
Review the following summary sheets which as a whole include the materials we have covered in this course:
If you think you have prepared a better one, kindly send it to me via an attached email. Thank you.
Review your past assignments. Ask yourself: What have I learned up to now? Your preparation is a very important undertaking in terms of integrating what you have learned each week in order to see the whole picture and inter-connectivity of the topics.
Read thoughtfully the Why List (Word.Doc), containing a set of good questions, asked by your classmates.
For practice questions, visit also the Web site Practice Questions, ALL sections including ANOVA, and Regression Analysis.
I do suggest that you prepare a few pages of your own summary sheets.
Your mind is what your brain does. Self-consciousness is self-knowledge. The process of becoming conscious distributes what you know throughout your brain via the brain neural network branches, unlike memorizing, which connects only two nodes of the network. The availability and expansion of what you know throughout your neural network branches make the information processing of your brain accurate. Thus, you possess a reflective, brilliant knowledgeable mind.
The process of making your own summary sheet is the idea of contemplating the topics you have learned. By definition of esthetics, the longer you contemplate on what you have learned the more beautiful the subject matter becomes. Beauty and contemplation is distinguished from other mental manifestations; contemplation is the result of the perfect apprehension of relations and topics.
Use the following guide to prepare your summary sheets:
The above process helps to crystallize your mind to be reflective and responsive to questions posed about topics you've learned in this course and reinforces the topics in your mind.
I Am Confused: How To Know When To Apply What Formulas And Calculations In Word Problems?
I have received the following honest concern and difficulty from one of your classmates. It will be beneficial to read and apply my recommendations:
..The muddiest points still remaining are how to know when to apply what formulas and calculations in word problems?
You are not alone on this. Since you are learning little-by-little every week, it is a very natural desire to see the wholeness and manifoldness of topics. Therefore, it is natural to feel confused because of accumulation of different topics. However we must cross over to the other side of confusion where by thinking clearly and distinctively you will feel comfortable.
As you know by now, the ingredient components of what you should master are:
To master what you are learning, I recommend you prepare a summary sheet of the main topics you have learned in any given week.
Exercise Your Knowledge to Enhance What You Have Learned (PDF)
A statistics summary sheet formulas for the mean(PDF, print to enlarge).
If you think you have prepared a better one, kindly send it to me via an attached email. Thank you.
Please read the following information carefully.
The main purpose of taking the examinations is to find out how reflective your mind is in answering a set of questions correctly. The objective is to maximize the number of correct solutions, subject to a limited time constraint.
Your final examination has the similar format as your midterm, consisting of two parts.